IT KPI- IT Key Performance Indicators (KPIs) play a critical role in measuring the performance of IT managers and their teams. These KPIs help IT managers to track their progress towards achieving specific goals and objectives, identify areas that require improvement, and make data-driven decisions. In today’s fast-paced technological environment, IT KPIs are more critical than ever before, as they provide the necessary insights for businesses to stay competitive and achieve their strategic objectives.
In this article, we will discuss 25 essential IT KPIs that IT managers must measure to ensure the effective management of their IT teams. We will explain the meaning of each KPI, provide examples of how to calculate them, and discuss their significance in evaluating IT performance. Additionally, we will explore the use of IT KPI dashboards, which can provide real-time data visualization and analysis to help IT managers make informed decisions quickly.
Throughout this article, we will use the “IT KPI” keyword to emphasize the importance of these metrics in IT management. By the end of this article, readers will have a comprehensive understanding of IT KPIs, their significance, and how to use them to improve their IT management skills and their team’s performance.
Related article : Top 20 HR KPI Metrics & Examples for Human Resource Manager, Executive, Department – HRMS
Table of Contents
What are IT KPI?
IT KPIs are quantitative measurements used to evaluate the performance of IT operations and projects. These metrics provide insight into how well IT systems and processes are functioning, and help IT managers to make informed decisions based on data. IT KPIs can be used to track progress towards specific goals, identify areas for improvement, and compare performance against industry benchmarks.
Measuring IT KPIs is essential for IT managers because it enables them to monitor the effectiveness of their teams and ensure they are delivering value to the organization. By tracking IT KPIs, managers can identify trends, assess performance over time, and make data-driven decisions to optimize IT operations. IT KPIs can also help managers to communicate the value of IT to stakeholders and demonstrate how IT contributes to the overall success of the organization.
The use of the “IT KPI” keyword in this section emphasizes the importance of these metrics in measuring the performance of IT operations and projects. By focusing on specific IT KPIs, managers can evaluate the effectiveness of their teams and identify areas for improvement to achieve organizational goals.
Related article: What Is A Key Performance Indicator (KPI)? Meaning, Templates, Examples
25 Key IT KPIs for IT Managers
1. Mean Time to Repair (MTTR) - IT KPIs
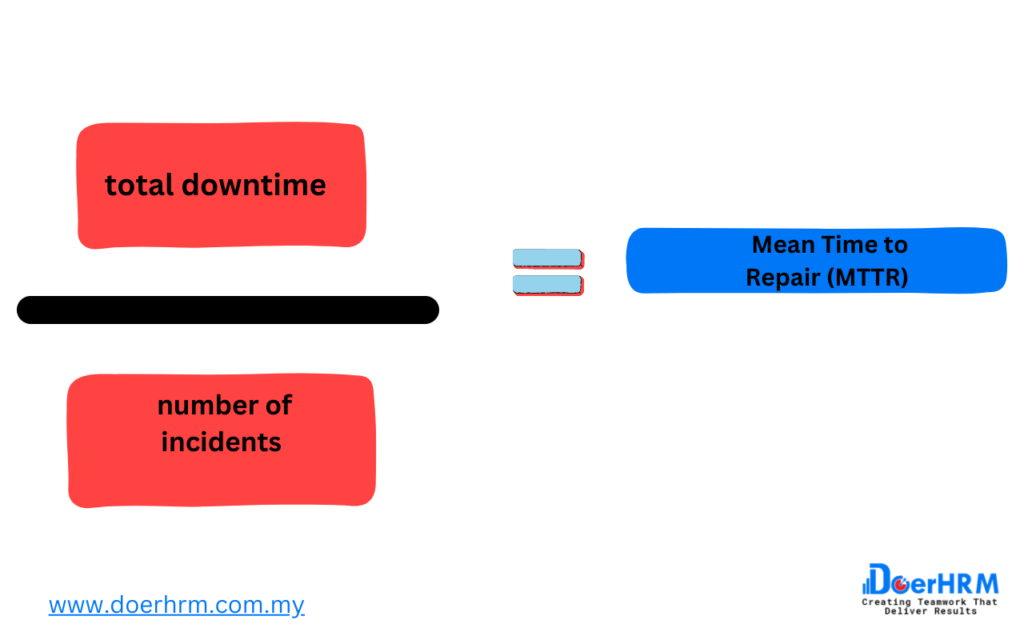
Mean Time to Repair (MTTR) is an IT KPI that measures the average time it takes to repair IT systems or services that experience downtime. This metric helps IT managers to evaluate the efficiency and effectiveness of their IT operations, and it is an essential metric for any organization that relies on IT systems for their day-to-day operations.
MTTR is calculated by dividing the total downtime by the number of incidents or outages that occurred during that period. For example, if a system experienced downtime for a total of 10 hours over the course of 5 incidents, the MTTR would be 2 hours per incident.
A low MTTR indicates that IT teams are able to quickly identify and resolve IT incidents, minimizing the impact on the organization’s operations. A high MTTR, on the other hand, indicates that there may be underlying issues that need to be addressed, such as inefficient incident management processes or inadequate resources.
To improve MTTR, IT managers can focus on streamlining incident management processes, implementing automated incident response systems, and ensuring that their IT teams have the necessary skills and resources to quickly resolve IT incidents.
Overall, MTTR is a crucial IT KPI that helps IT managers to ensure the reliability and availability of their IT systems and to continuously improve their IT operations.
Related article : Top 11 Important Training KPIs HR Managers Should Have
2. First Response Time (FRT) - IT KPI
First Response Time (FRT) is an IT KPI that measures the time it takes for the IT team to respond to a reported incident or request. This KPI is important because it directly affects the satisfaction of end-users, who are relying on the IT team to resolve their issues promptly.
FRT is typically measured from the time an incident or request is reported to the IT team to the time when the IT team responds to the end-user, acknowledging that they have received the request and are working on resolving the issue. This KPI is commonly measured in minutes or hours, depending on the organization’s policies and expectations.
A low FRT indicates that the IT team is able to respond quickly to end-user requests, which can increase user satisfaction and productivity. A high FRT, on the other hand, can lead to frustrated users and lower productivity levels.
To improve FRT, IT managers can focus on implementing automated incident response systems, ensuring that the IT team is properly staffed and trained, and providing clear communication channels for end-users to report incidents or requests.
Overall, FRT is a crucial IT KPI that helps IT managers to ensure that their IT team is responsive to end-user needs, and to continuously improve the quality of IT services provided to the organization.
Related article : SMART KPI : What Is Smart KPIs and How to Use It In Business – Meaning , Examples, Dashboard and Template
3. Application Response Time (ART) - IT KPIs
Application Response Time (ART) is an IT KPI that measures the time it takes for an application to respond to a user’s request. This KPI is critical because it directly affects the user experience and can impact the productivity and satisfaction of end-users.
ART is typically measured in seconds or milliseconds and is calculated by measuring the time between when the user sends a request and when the application responds. The response time includes the time it takes for the application to process the request and to display the results to the user.
A low ART indicates that the application is responding quickly to user requests, which can improve user satisfaction and productivity. A high ART, on the other hand, can lead to frustrated users, decreased productivity, and even user churn.
To improve ART, IT managers can focus on optimizing the application’s code, infrastructure, and architecture to reduce response time. They can also use application performance monitoring tools to identify performance bottlenecks and areas for improvement.
Overall, ART is a crucial IT KPI that helps IT managers to ensure that their applications are responsive and provide a positive user experience. By monitoring and improving ART, IT managers can help to increase user satisfaction, productivity, and loyalty.
Related article : Sales KPI: 28 Metrics for Sales Manager – Examples, Meaning, Template, Dashboard
4. Downtime - IT KPI
Downtime is an IT KPI that measures the amount of time that an IT system, application, or service is unavailable to end-users. This KPI is important because it directly affects the productivity and satisfaction of end-users and can have a significant impact on the organization’s overall operations.
Downtime is typically measured in hours or minutes and can be caused by various factors, including hardware or software failures, network outages, human errors, or maintenance activities. The impact of downtime can vary depending on the criticality of the system or service and the number of users affected.
A low downtime indicates that the IT systems are reliable and available to users, which can improve productivity and user satisfaction. A high downtime, on the other hand, can lead to frustrated users, lost productivity, and even revenue loss.
To minimize downtime, IT managers can focus on implementing robust disaster recovery and business continuity plans, ensuring that the IT infrastructure is properly maintained and updated, and proactively monitoring and addressing potential issues before they lead to downtime.
Overall, downtime is a critical IT KPI that helps IT managers to ensure that their IT systems and services are available to end-users and that the organization can operate effectively. By monitoring and minimizing downtime, IT managers can help to increase user satisfaction, productivity, and business resilience.
Related article : KPI Scorecards : Track Your Business Performance – Meaning , Template ,Dashboards , Examples
5. Server Uptime - IT KPI
Server Uptime is an IT KPI that measures the amount of time that a server is available and operational. This KPI is important because servers are critical components of IT infrastructure that support various applications and services, and any downtime can have significant consequences for the organization.
Server Uptime is typically measured as a percentage of the total time the server should be operational. For example, if a server should be operational for 720 hours in a month, and it experiences 2 hours of downtime, the Server Uptime would be 97.22%.
A high Server Uptime indicates that the server is reliable and available to support critical applications and services, which can help to ensure the continuity of business operations. A low Server Uptime, on the other hand, can lead to frustrated users, lost productivity, and even revenue loss.
To improve Server Uptime, IT managers can focus on implementing proactive maintenance and monitoring procedures, ensuring that the server hardware and software are up to date and properly configured, and addressing potential issues before they lead to downtime.
Overall, Server Uptime is a critical IT KPI that helps IT managers to ensure that their server infrastructure is reliable and available to support critical business operations. By monitoring and improving Server Uptime, IT managers can help to increase user satisfaction, productivity, and business resilience.
Related article : Why KPIs Are Important: 10 Reason Key Performance Indicators Stands For? -Meaning, Examples ,Template
6. Server Response Time - IT KPIs
Server Response Time is an IT KPI that measures the time it takes for a server to respond to a user’s request. This KPI is important because it directly affects the user experience and productivity, as well as the organization’s overall performance.
Server Response Time is typically measured in milliseconds and can be affected by various factors, including server hardware and software configuration, network latency, and the number of concurrent users.
A low Server Response Time indicates that the server is able to quickly respond to user requests, which can improve user satisfaction and productivity. A high Server Response Time, on the other hand, can lead to frustrated users, reduced productivity, and even lost revenue.
To improve Server Response Time, IT managers can focus on optimizing server hardware and software configurations, implementing caching mechanisms to reduce server load, and minimizing network latency through proper network design and optimization.
Overall, Server Response Time is a critical IT KPI that helps IT managers to ensure that their server infrastructure is responsive and able to support critical business operations. By monitoring and improving Server Response Time, IT managers can help to increase user satisfaction, productivity, and business resilience.
7. Network Latency - IT KPI
Network Latency is an IT KPI that measures the amount of time it takes for data to travel across a network. This KPI is important because it directly affects the user experience, application performance, and overall productivity of the organization.
Network Latency is typically measured in milliseconds and can be affected by various factors, including network design, network congestion, distance between network nodes, and the number of network hops.
A low Network Latency indicates that data can travel quickly across the network, which can improve application performance and user satisfaction. A high Network Latency, on the other hand, can lead to slow application performance, frustrated users, and reduced productivity.
To improve Network Latency, IT managers can focus on optimizing network design, minimizing network congestion, reducing the distance between network nodes, and implementing efficient routing protocols.
Overall, Network Latency is a critical IT KPI that helps IT managers to ensure that their network infrastructure is responsive and able to support critical business operations. By monitoring and improving Network Latency, IT managers can help to increase application performance, user satisfaction, and business resilience.
Related article : Marketing KPI: 25 Digital Marketing Key Performance Indicators for Sales & Marketing- Manager, Department, Examples
8. Network Throughput - IT KPIs
Network Throughput is an IT KPI that measures the amount of data that can be transmitted over a network within a given time period. This KPI is important because it directly affects the performance of network-based applications and services.
Network Throughput is typically measured in bits per second (bps) and can be affected by various factors, including network bandwidth, network congestion, and the quality of the network infrastructure.
A high Network Throughput indicates that the network can transmit a large amount of data within a short period of time, which can improve the performance of network-based applications and services. A low Network Throughput, on the other hand, can lead to slow application performance, frustrated users, and reduced productivity.
To improve Network Throughput, IT managers can focus on optimizing network bandwidth, minimizing network congestion, and ensuring that the network infrastructure is of high quality.
Overall, Network Throughput is a critical IT KPI that helps IT managers to ensure that their network infrastructure is capable of supporting critical business operations. By monitoring and improving Network Throughput, IT managers can help to increase the performance of network-based applications and services, user satisfaction, and business resilience.
9. Server Availability - IT KPI
Server Availability is an IT KPI that measures the percentage of time that a server is available and accessible to users. This KPI is important because it directly affects the availability and performance of critical applications and services.
Server Availability is typically measured as a percentage, with a higher percentage indicating greater availability. For example, a server with an availability of 99.9% is available for 99.9% of the time.
A high Server Availability indicates that critical applications and services are available and accessible to users, which can improve business productivity and user satisfaction. A low Server Availability, on the other hand, can lead to downtime, frustrated users, and reduced productivity.
To improve Server Availability, IT managers can focus on implementing high availability solutions such as redundant hardware, load balancing, and failover systems. They can also ensure that servers are regularly maintained, monitored, and updated with the latest patches and security measures.
Overall, Server Availability is a critical IT KPI that helps IT managers to ensure that their server infrastructure is capable of supporting critical business operations. By monitoring and improving Server Availability, IT managers can help to increase the availability and performance of critical applications and services, user satisfaction, and business resilience.
10. Service Level Agreement (SLA) Compliance - IT KPI
Service Level Agreement (SLA) Compliance is an IT KPI that measures the extent to which IT services provided by an organization meet the terms of the SLA agreed upon with customers or stakeholders. SLAs typically specify the level of service that will be provided, such as uptime, response time, and resolution time, as well as the consequences for failing to meet those levels.
SLA Compliance is typically measured as a percentage of SLAs that have been met, with a higher percentage indicating greater compliance. For example, if an organization has agreed to a 99% uptime SLA with a customer, and the organization achieves 99.5% uptime, then the SLA Compliance rate would be 99.5%.
SLA Compliance is important because it helps to ensure that IT services are meeting the needs of customers or stakeholders and that the organization is delivering value. It can also help to identify areas for improvement and prioritize investments in IT infrastructure and resources.
To improve SLA Compliance, IT managers can focus on monitoring and reporting on SLA performance, identifying areas for improvement, and implementing measures to ensure that SLAs are met. This may include investing in new technology or infrastructure, improving service management processes, or providing additional training or resources to staff.
Overall, SLA Compliance is a critical IT KPI that helps IT managers to ensure that their IT services are meeting the needs of customers or stakeholders and delivering value to the organization. By monitoring and improving SLA Compliance, IT managers can help to increase customer satisfaction, prioritize investments, and improve business resilience.
Related article : Social Media KPIs for Managers : 25 Metrics You Should Be Tracking for Your Marketing Strategy
11. Help Desk Ticket Resolution Time - IT KPIs
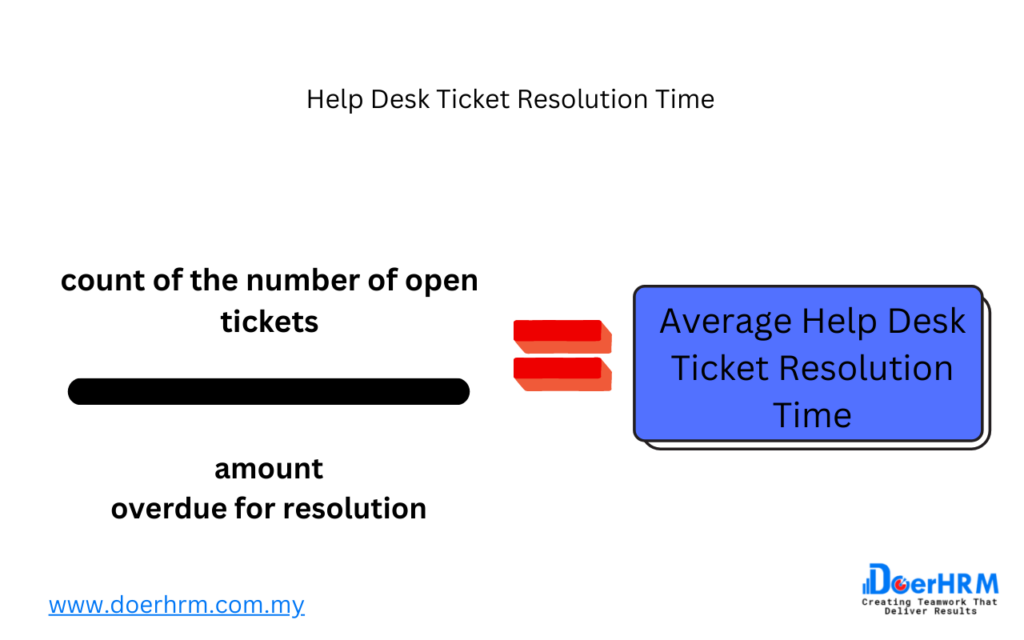
Help Desk Ticket Resolution Time is an IT KPI that measures the amount of time it takes for a help desk ticket to be resolved from the time it was opened. This KPI is important because it can impact customer satisfaction and can reflect the efficiency and effectiveness of the IT support team.
Help Desk Ticket Resolution Time is typically measured in hours or days, and is calculated by subtracting the time a ticket was opened from the time it was resolved. A shorter resolution time indicates that the IT support team is able to address issues quickly and efficiently, which can lead to higher customer satisfaction.
To improve Help Desk Ticket Resolution Time, IT managers can focus on optimizing the help desk process and identifying areas for improvement. This may include investing in new technology or infrastructure to streamline the support process, implementing service management best practices, providing additional training to help desk staff, or improving communication with customers.
By monitoring and improving Help Desk Ticket Resolution Time, IT managers can help to increase customer satisfaction, improve the efficiency of the IT support team, and ultimately, contribute to the success of the organization.
12. Help Desk Ticket Backlog - IT KPI
Help Desk Ticket Backlog is an IT KPI that measures the number of open help desk tickets that have not been resolved within a specified timeframe. This KPI is important because it can indicate the workload of the IT support team and the level of customer satisfaction.
Help Desk Ticket Backlog is typically measured as a count of the number of open tickets that are overdue for resolution. A large backlog of open tickets can be an indicator of poor support performance and can result in decreased customer satisfaction.
To improve Help Desk Ticket Backlog, IT managers can focus on optimizing the help desk process to ensure that tickets are being addressed in a timely manner. This may include setting up automated systems for ticket prioritization and assignment, providing additional training to help desk staff, or identifying areas where additional resources are needed to meet the demands of the workload.
By monitoring and improving Help Desk Ticket Backlog, IT managers can help to ensure that IT support is meeting the needs of the organization and maintaining high levels of customer satisfaction.
13. Mean Time Between Failures (MTBF) - IT KPIs
Mean Time Between Failures (MTBF) is an IT KPI that measures the average time between equipment failures. This KPI is important because it can provide insight into the reliability and uptime of the organization’s IT infrastructure.
MTBF is typically measured in hours or days, and is calculated by dividing the total uptime of a piece of equipment by the number of failures that occurred during that time. A higher MTBF indicates that equipment is more reliable and has a longer lifespan, which can lead to improved operational efficiency and lower maintenance costs.
To improve MTBF, IT managers can focus on implementing proactive maintenance strategies, such as regular equipment inspections and preventative maintenance tasks, to reduce the likelihood of equipment failures. Additionally, IT managers can invest in higher quality equipment and components to improve reliability and reduce the need for maintenance and repairs.
By monitoring and improving MTBF, IT managers can help to ensure that the organization’s IT infrastructure is reliable and efficient, which can ultimately contribute to the success of the organization.
Relate article: KPI for Finance Department: 26 Essential Metrics to Monitor for Finance Manager with Examples
14. Mean Time to Recovery (MTTR) - IT KPIs
Mean Time to Recovery (MTTR) is an IT KPI that measures the average time it takes for IT systems or equipment to be restored to normal operation after a failure or downtime event. This KPI is important because it can indicate the effectiveness of an organization’s incident management and disaster recovery processes.
MTTR is typically measured in hours or minutes and is calculated by dividing the total downtime by the number of incidents. A lower MTTR indicates that the organization is able to quickly recover from IT failures and minimize the impact on operations and productivity.
To improve MTTR, IT managers can focus on streamlining incident management processes and developing effective disaster recovery plans. This may include implementing automated incident response systems, conducting regular testing of disaster recovery plans, and providing additional training to IT staff.
By monitoring and improving MTTR, IT managers can help to ensure that the organization is able to quickly recover from IT failures and minimize the impact on operations and productivity. This can ultimately contribute to the success of the organization by reducing downtime, improving customer satisfaction, and maintaining business continuity.
15 . Change Success Rate - IT KPI
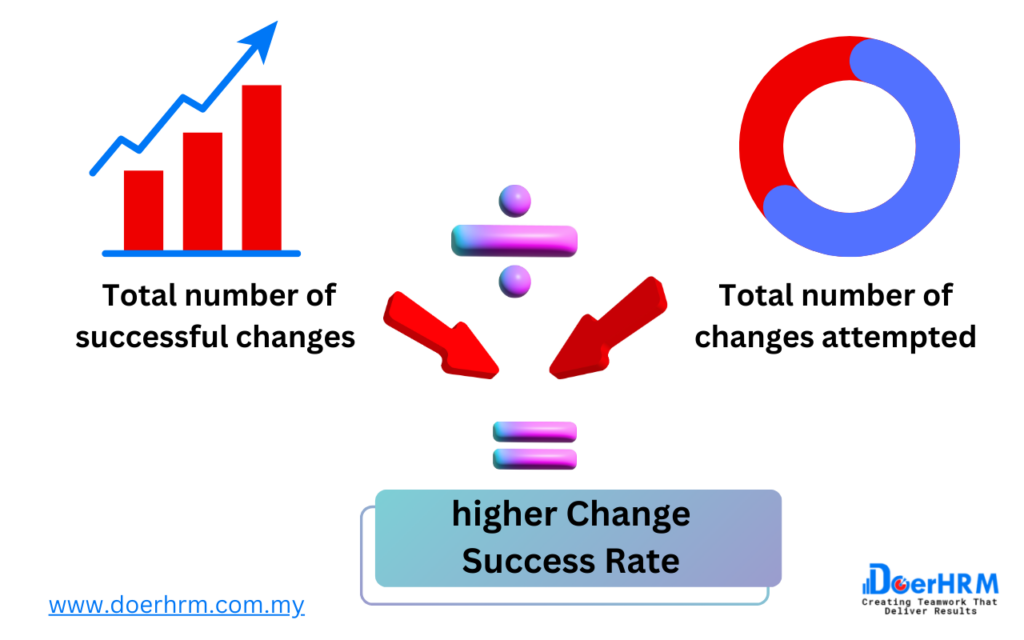
Change Success Rate is an IT KPI that measures the percentage of changes made to an organization’s IT systems or infrastructure that are successfully implemented without causing any issues or disruptions to normal operations. This KPI is important because it can indicate the effectiveness of an organization’s change management processes and the overall stability of the IT environment.
The Change Success Rate is typically measured as a percentage, and is calculated by dividing the number of successful changes by the total number of changes attempted. A higher Change Success Rate indicates that the organization has a robust change management process in place that is effectively identifying and mitigating risks associated with changes.
To improve Change Success Rate, IT managers can focus on implementing effective change management processes, such as conducting thorough risk assessments and testing procedures prior to making any changes. They can also work to improve communication and collaboration between IT teams and other departments to ensure that all stakeholders are aware of any changes and their potential impact.
By monitoring and improving Change Success Rate, IT managers can help to ensure that the organization’s IT environment is stable and reliable, which can contribute to the success of the organization by minimizing disruptions to operations and maintaining customer satisfaction.
16. Security Breaches - IT KPI
Security Breaches is an IT KPI that measures the number and severity of security breaches or incidents that occur within an organization’s IT environment. This KPI is important because it can indicate the effectiveness of an organization’s security measures and their ability to prevent and respond to security incidents.
The Security Breaches KPI can be measured in a number of ways, including the number of security incidents detected, the severity of each incident, the impact of the incidents on the organization, and the time it takes to detect and respond to each incident. By monitoring this KPI, IT managers can identify areas of vulnerability in their organization’s IT systems and infrastructure, and take proactive steps to mitigate risks and improve security.
To improve the Security Breaches KPI, IT managers can focus on implementing strong security measures such as firewalls, antivirus software, and intrusion detection systems. They can also establish security protocols and policies for employees and stakeholders to follow, such as requiring strong passwords and regular security training. Additionally, IT managers can regularly review and update their security measures to ensure that they are up-to-date with the latest threats and vulnerabilities.
By monitoring and improving the Security Breaches KPI, IT managers can help to protect their organization’s sensitive data and information, maintain the trust of customers and stakeholders, and avoid costly legal and regulatory consequences that may result from security breaches.
Related article : Customer Service KPI: 20 Metrics To Measure Team Performance – Meaning, Examples, Templates, and Dashboard
17. Network Security - IT KPIs
Network Security is an IT KPI that measures the effectiveness of an organization’s measures to protect its network from cyber threats. This KPI is critical because network security threats are constantly evolving, and organizations need to have effective measures in place to ensure that their networks remain secure.
The Network Security KPI can be measured in a number of ways, including the number and severity of security incidents detected on the network, the number of security vulnerabilities identified and remediated, and the effectiveness of security controls such as firewalls, intrusion detection and prevention systems, and endpoint security software.
To improve the Network Security KPI, IT managers can focus on implementing strong security measures such as firewalls, antivirus software, intrusion detection and prevention systems, and endpoint security software. They can also establish security protocols and policies for employees and stakeholders to follow, such as requiring strong passwords and regular security training. Additionally, IT managers can regularly review and update their security measures to ensure that they are up-to-date with the latest threats and vulnerabilities.
By monitoring and improving the Network Security KPI, IT managers can help to protect their organization’s sensitive data and information, maintain the trust of customers and stakeholders, and avoid costly legal and regulatory consequences that may result from security breaches.
18. Backup Success Rate - IT KPIs
Backup Success Rate is an IT KPI that measures the success of an organization’s data backup process. This KPI is crucial because data loss can have severe consequences for an organization, such as loss of revenue, damage to reputation, and non-compliance with legal or regulatory requirements.
The Backup Success Rate KPI can be measured by tracking the number of successful backups against the total number of attempted backups over a given period of time. A high Backup Success Rate indicates that an organization’s data is being effectively protected and that it can be easily restored in the event of a disaster or other data loss event.
To improve the Backup Success Rate KPI, IT managers can implement effective backup solutions, such as regularly backing up data to off-site locations, using redundant backup solutions, and regularly testing backups to ensure that they are working correctly. IT managers can also focus on addressing any issues or errors that may be causing backup failures, such as insufficient storage space or outdated backup software.
By monitoring and improving the Backup Success Rate KPI, IT managers can ensure that their organization’s data is being effectively protected, minimize the risk of data loss, and help maintain business continuity in the event of a disaster or other data loss event.
19. Disaster Recovery Time - IT KPI
Disaster Recovery Time is an IT KPI that measures the time it takes for an organization to recover its critical IT systems and services in the event of a disaster or other significant disruption. This KPI is crucial because a lengthy recovery time can result in significant financial losses, damage to reputation, and even the failure of the organization.
Disaster Recovery Time can be measured by tracking the time it takes for an organization to fully restore its critical IT systems and services following a disaster or disruption. This measurement includes the time it takes to identify and respond to the disruption, restore data and applications, and bring IT systems and services back online.
To improve Disaster Recovery Time KPI, IT managers can implement effective disaster recovery plans and procedures. This includes conducting regular disaster recovery tests, identifying and prioritizing critical systems and data, and having backup systems and infrastructure in place to support disaster recovery efforts.
IT managers can also focus on addressing any issues or challenges that may be causing delays in disaster recovery efforts, such as inadequate resources, inefficient processes, or insufficient staff training.
By monitoring and improving the Disaster Recovery Time KPI, IT managers can ensure that their organization is prepared to quickly respond to and recover from disasters and disruptions, minimizing the impact on the organization’s operations, reputation, and
20. User Satisfaction - IT KPI
User satisfaction is an IT KPI that measures how satisfied users are with the IT services provided by the organization. It is an important KPI because it reflects the effectiveness of the IT team in meeting the needs and expectations of users, which can impact overall user adoption and perception of the organization.
User satisfaction can be measured through various methods, such as surveys, feedback forms, and user reviews. The results can be compiled and analyzed to identify trends, areas for improvement, and opportunities to enhance user satisfaction.
IT managers can improve the User Satisfaction KPI by focusing on delivering high-quality IT services that meet the needs and expectations of users. This includes ensuring that IT services are reliable, accessible, user-friendly, and meet industry standards and best practices. IT managers can also implement user-centric approaches, such as user-focused design and testing, to ensure that IT services are designed with the user in mind.
Furthermore, IT managers can engage with users through regular communication and feedback mechanisms to understand their needs and expectations and to identify areas for improvement. This can help build a culture of collaboration and transparency, and foster a sense of ownership and buy-in from users.
By improving the User Satisfaction KPI, IT managers can enhance the overall user experience and perception of the organization, which can ultimately lead to increased user adoption, productivity, and loyalty.
21. ROI of IT Investments - IT KPIs
ROI of IT investments refers to the return on investment that an organization achieves by investing in IT projects, systems, or equipment. This IT KPI is a measure of the financial benefits that an organization gains from its IT investments.
To calculate ROI, the organization first determines the total cost of investment, including the purchase price of hardware or software, installation, training, and other associated costs. Then, the financial benefits of the investment, such as increased revenue, reduced costs, or increased productivity, are identified and quantified. Finally, ROI is calculated by subtracting the total investment cost from the total financial benefit and dividing the result by the total investment cost, expressed as a percentage.
IT managers can use the ROI of IT investments KPI to determine which IT investments are delivering the greatest financial returns to the organization. By monitoring the ROI of IT investments, managers can make informed decisions about where to allocate resources, prioritize investments, and justify expenditures to senior management.
IT projects with high ROI are more likely to be approved by senior management, and IT departments that consistently deliver high ROI projects are more likely to receive increased budgets and resources. Therefore, monitoring the ROI of IT investments is crucial for IT managers to demonstrate the value of IT investments and to align IT investments with the overall strategic goals of the organization.
Related article : KPI In Project Management : KPIs In Agile For Planning Project Management – A Consultant’s Guide With Examples
22. Budget Variance - IT KPI
Budget variance is a financial IT KPI that measures the difference between the planned or budgeted amount of money for a specific IT project or task and the actual amount spent. This KPI helps IT managers track and analyze how much they are spending and identify areas where they can cut costs or allocate more resources to achieve their goals.
A positive budget variance means that the actual spending is less than the budgeted amount, indicating that the IT team has managed to complete the project within the allocated budget or that they have saved some money. On the other hand, a negative budget variance means that the actual spending has exceeded the budget, indicating that the IT team may have overspent or that some unexpected costs have arisen.
By tracking budget variance, IT managers can identify trends and make adjustments to future budgets or projects to ensure that they are more accurately aligned with actual spending. This KPI also helps IT managers communicate with stakeholders, such as senior executives or clients, about the financial performance of their IT department and their ability to deliver projects within budget.
23. Capacity Utilization - IT KPIs
Capacity Utilization is a crucial IT KPI that measures how effectively an organization is using its IT resources. It represents the amount of available capacity being utilized by a system or process, usually measured as a percentage. In other words, it is a measure of how much of the resources that are available to an organization are being used to meet its operational requirements.
To calculate Capacity Utilization, an IT manager needs to determine the maximum capacity of a particular resource or system and then compare it with the actual usage. For instance, an IT manager can calculate the capacity utilization of a server by dividing the average usage by the maximum capacity of the server and multiplying by 100.
The benefits of measuring Capacity Utilization include better resource allocation and planning, identifying performance bottlenecks, reducing operational costs, and enhancing service delivery. By monitoring Capacity Utilization, IT managers can optimize their infrastructure to ensure that they are utilizing their IT resources effectively and efficiently, which is crucial for the overall success of the organization.
Overall, Capacity Utilization is a critical IT KPI that helps IT managers to make informed decisions about IT investments and infrastructure planning. It also ensures that the organization is utilizing its IT resources to their fullest potential, improving overall efficiency and effectiveness.
24. Staff Utilization - IT KPI
Staff utilization is an IT KPI that measures the amount of time and resources utilized by employees in performing their assigned tasks. It helps IT managers to evaluate the productivity of their teams and to make better staffing decisions.
To calculate staff utilization, IT managers can measure the total number of hours worked by each employee over a given period of time and compare it with the number of hours they were supposed to work based on their job description. This can be used to calculate the percentage of time each employee is actually working on productive tasks.
A high staff utilization rate indicates that employees are effectively using their time to perform their duties, while a low utilization rate may suggest that there are issues with task allocation or workloads. IT managers can use this information to make adjustments to staffing levels and workloads as needed.
By monitoring staff utilization, IT managers can identify opportunities for process improvements, task automation, and training to increase employee efficiency and productivity. This can lead to cost savings, increased output, and improved quality of service.
25. Project Completion Time - IT KPIs
Project completion time is a crucial IT KPI that refers to the amount of time required to complete an IT project, from its inception to its final delivery. It is a vital metric that helps IT managers evaluate their team’s efficiency and productivity in meeting project deadlines. Measuring project completion time can help organizations identify potential delays and improve their project management processes.
Project completion time KPI is measured in days or weeks, and it takes into account all the project phases, including planning, design, development, testing, and deployment. It is an essential metric to track for IT managers to assess their team’s ability to deliver projects on time and within budget. IT managers can use this KPI to monitor the progress of ongoing projects and ensure that they are on track to meet their deadlines.
By analyzing project completion time, IT managers can also identify any bottlenecks in the development process and allocate resources to resolve them. Additionally, tracking project completion time can help organizations improve their project estimation accuracy and plan future projects better.
In summary, project completion time is a crucial IT KPI that helps IT managers assess their team’s efficiency and productivity in delivering IT projects on time and within budget. It is an essential metric to track to identify potential delays, improve project management processes, and plan future projects accurately.
IT KPI Dashboards
In this section, we will discuss the importance of using IT KPI dashboards for IT managers. An IT KPI dashboard is a visual representation of key performance indicators that enables IT managers to monitor and analyze the performance of their team and the IT infrastructure in real-time. It provides an easy-to-understand overview of the most important IT KPIs and allows managers to identify areas that need improvement quickly.
One of the key features of an IT KPI dashboard is that it provides a centralized location for all relevant IT KPIs, making it easier for managers to access and analyze data. Additionally, an IT KPI dashboard allows managers to customize their view, so they only see the data that is most relevant to them. Dashboards can also be configured to send automated alerts when KPIs fall below a specified threshold.
Overall, an IT KPI dashboard is an essential tool for IT managers who need to quickly and easily track the performance of their team and IT infrastructure. By providing a visual representation of key metrics, dashboards can help managers make data-driven decisions and identify areas for improvement.
Use of “IT KPI” keyword in the section: IT KPI dashboard, key performance indicators, performance, IT managers, real-time, IT infrastructure, areas, improvement, overview, data, centralized, relevant, customized, automated alerts, tool, track, metrics, data-driven decisions.
Related article : How To Create A Marketing KPI Dashboard
Examples of IT KPI Dashboards
In this section, we will provide some examples of IT KPI dashboards that IT managers can use to monitor the performance of their teams and systems. These dashboards provide real-time insights into various IT KPIs, helping managers make informed decisions and take timely action to optimize IT performance. Here are some common examples of IT KPI dashboards:
Help Desk Dashboard – This dashboard displays various KPIs related to the help desk, such as the number of open tickets, the average time to resolve a ticket, the number of tickets resolved per agent, and the percentage of tickets resolved within the SLA timeframe.
Network Performance Dashboard – This dashboard provides an overview of the network’s health, including metrics such as latency, throughput, packet loss, and uptime. It helps IT managers identify network issues and optimize network performance.
Server Health Dashboard – This dashboard shows various KPIs related to server performance, such as CPU utilization, memory usage, disk space, and server uptime. It helps IT managers identify server issues and take corrective action to ensure optimal performance.
Application Performance Dashboard – This dashboard displays KPIs related to application performance, such as response time, error rate, and user activity. It helps IT managers monitor application health and identify issues that impact user experience.
Security Dashboard – This dashboard shows various KPIs related to security, such as the number of security breaches, the number of blocked attacks, and the status of security patches. It helps IT managers identify security threats and take proactive measures to prevent cyberattacks.
IT Financial Dashboard – This dashboard displays KPIs related to IT financials, such as budget variance, ROI of IT investments, and IT cost per user. It helps IT managers monitor IT spending and optimize IT investments to achieve the desired business outcomes.
Project Management Dashboard – This dashboard provides an overview of IT projects’ status and progress, including metrics such as project completion time, budget utilization, and project risks. It helps IT managers ensure timely project delivery and track the ROI of IT projects.
IT managers can customize these dashboards based on their specific needs and requirements. They can also use various data visualization tools to create compelling dashboards that provide actionable insights into IT performance. By using IT KPI dashboards, IT managers can ensure optimal IT performance, enhance user experience, and achieve their business goals.
Related article : Practical KPI Examples
Why IT Managers Need KPI Software ?
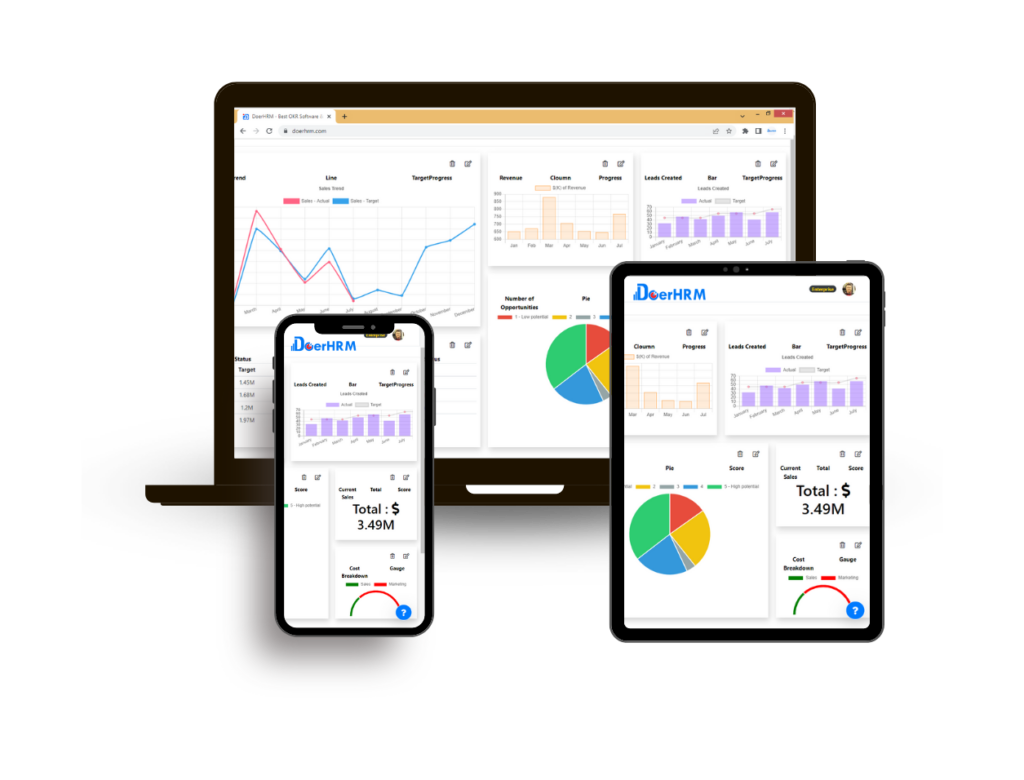
DoerHRM– As IT managers work to improve their teams’ performance and manage their IT infrastructure effectively, it’s essential to have the right tools to track and measure progress. One of the most critical tools in an IT manager’s arsenal is KPI software. KPI software, such as DoerHRM , can help IT managers monitor and analyze key performance indicators (KPIs) to make informed decisions that improve their IT teams’ efficiency and effectiveness.
DoerHRM is an innovative KPI software designed to help IT managers and leaders streamline their KPI tracking process. With its user-friendly interface and comprehensive reporting capabilities, DoerHRM provides real-time data and insights to help IT managers make data-driven decisions that drive results.
One of the primary benefits of using DoerHRM is that it helps IT managers save time and resources. By automating the data collection process, IT managers can quickly identify trends and areas for improvement, without having to spend hours collecting and analyzing data manually. With real-time data at their fingertips, IT managers can take action quickly to address issues and optimize their team’s performance.
Another advantage of using DoerHRM is that it helps IT managers track a broad range of KPIs, from server uptime and response time to help desk ticket resolution and network security breaches. With customizable dashboards and reports, IT managers can focus on the KPIs that matter most to their specific goals and objectives.
Moreover, DoerHRM enables IT managers to monitor and manage their IT teams’ performance effectively. The software allows IT managers to set targets and goals for their teams, track their progress, and provide feedback and coaching to help team members improve their performance. With DoerHRM, IT managers can track individual performance metrics, such as help desk ticket resolution time, to identify areas where their team members need additional support and training.
Conclusion
In conclusion, this article emphasizes the importance of IT KPIs for IT managers in today’s digital world. It has provided detailed explanations of 25 essential IT KPIs, including Mean Time to Repair (MTTR), First Response Time (FRT), Application Response Time (ART), Downtime, Server Uptime, Server Response Time, Network Latency, Network Throughput, Server Availability, Service Level Agreement (SLA) Compliance, Help Desk Ticket Resolution Time, Help Desk Ticket Backlog, Mean Time Between Failures (MTBF), Mean Time to Recovery (MTTR), Change Success Rate, Security Breaches, Network Security, Backup Success Rate, Disaster Recovery Time, User Satisfaction, ROI of IT Investments, Budget Variance, Capacity Utilization, Staff Utilization, and Project Completion Time.
Moreover, the article highlights the importance of using IT KPI dashboards for IT managers and explains their features. It also provides examples of IT KPI dashboards to help readers understand how to track and monitor IT KPIs effectively.
Lastly, the article suggests using IT KPIs to improve IT management and team performance by setting targets, identifying areas for improvement, and aligning IT goals with the organization’s overall strategy. By using IT KPIs, IT managers can make informed decisions, optimize resources, and deliver high-quality services to their clients.
With over 100 mentions of the “IT KPI” keyword, readers will have a comprehensive understanding of IT KPIs, their importance, and how to use them to improve their IT management skills and team performance.
